Since January 1, 2019, the Institute of Environmental Protection – National Research Institute (IOŚ-PIB) has been legally responsible for performing air quality modelling, including forecasts for the territory of Poland.
Short-term forecasts aim to predict smog conditions with a 72-hour lead time.
Daily forecast results for pollutants specified in national regulations are submitted daily to the Chief Inspectorate of Environmental Protection (GIOŚ) and published on the portal powietrze.gios.gov.pl.
- from April to September: PM10, NO2, O3
- from October to March: PM10, NO2, SO2
Additionally, the Institute of Environmental Protection – National Research Institute (IOŚ-PIB) assesses the overall level of exposure to harmful conditions according to the Air Quality Index of the Chief Inspectorate of Environmental Protection (GIOŚ)
Using additionally the concentration values of other forecasted pollutants, the Institute of Environmental Protection – National Research Institute (IOŚ-PIB) assesses the overall exposure level expressed as the Chief Inspectorate of Environmental Protection’s Air Quality Index (GIOŚ AQI).
Currently available are:
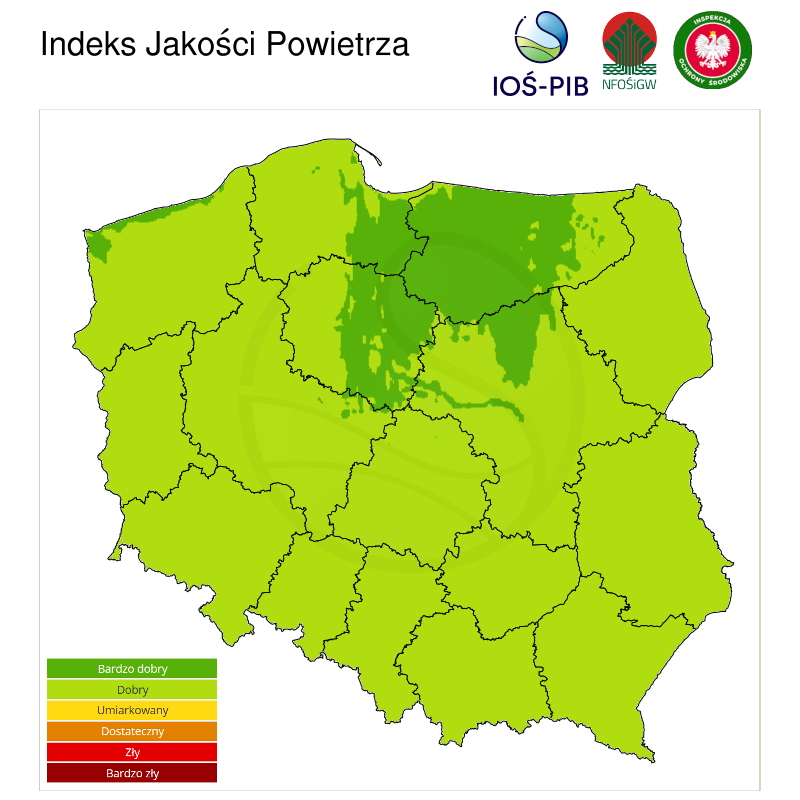
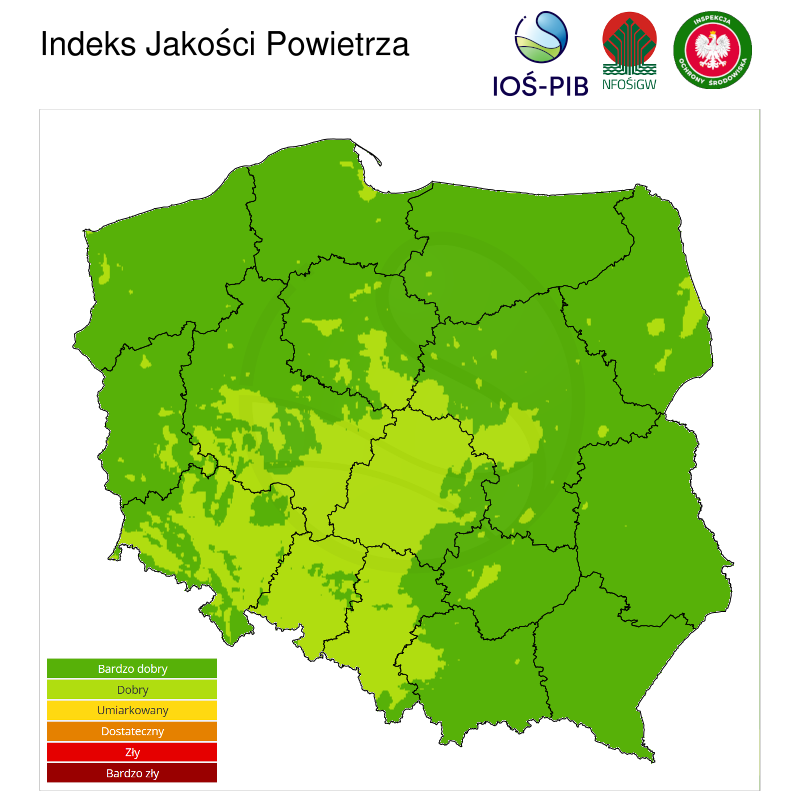
- average daily index maps for the next 3 days
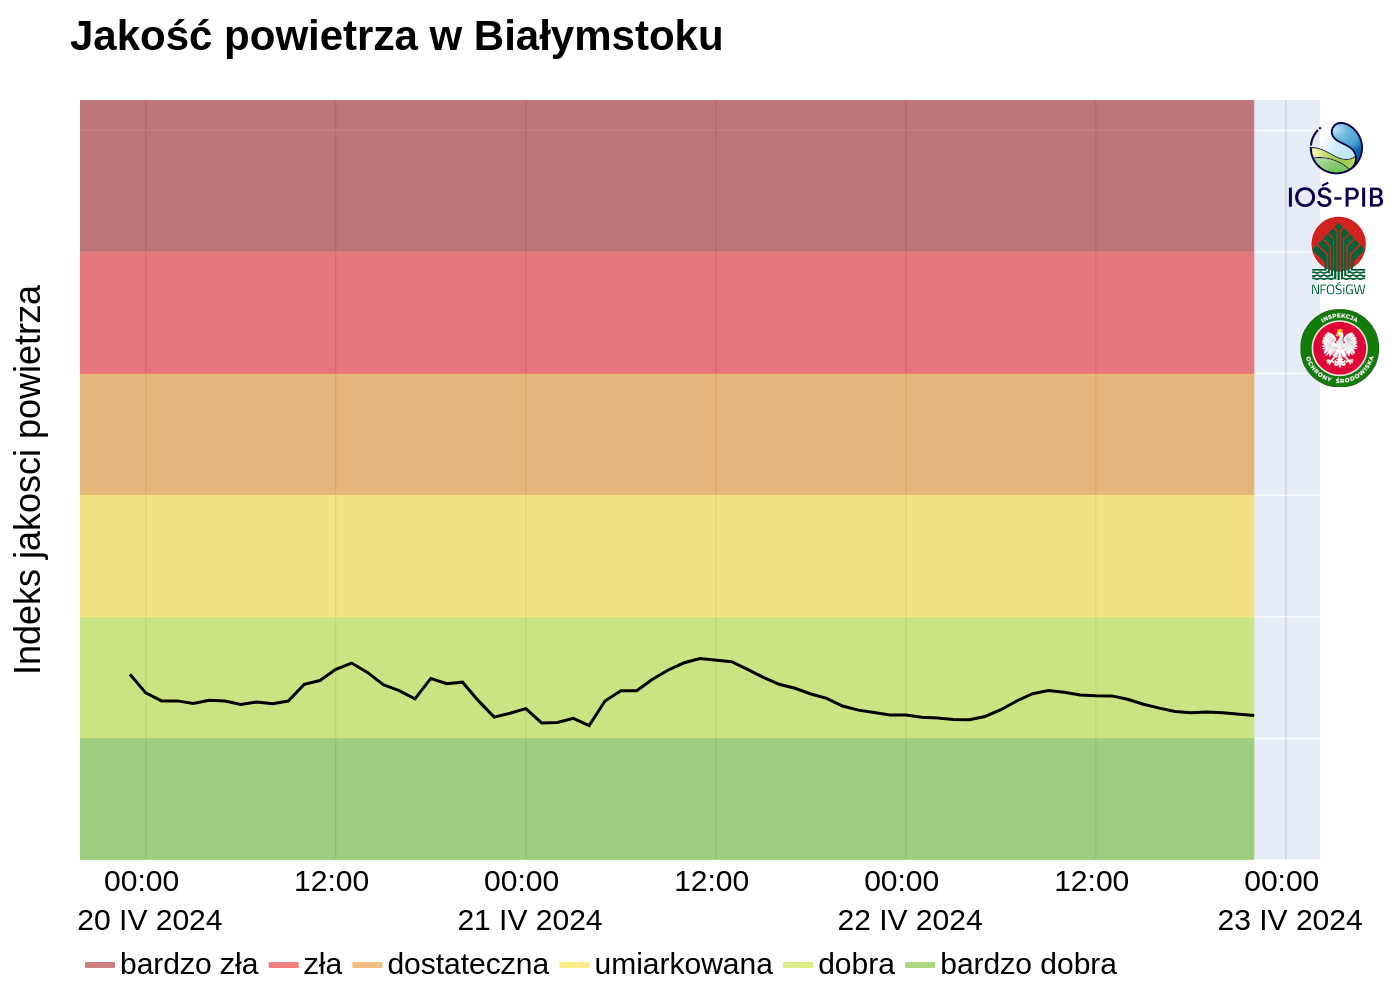
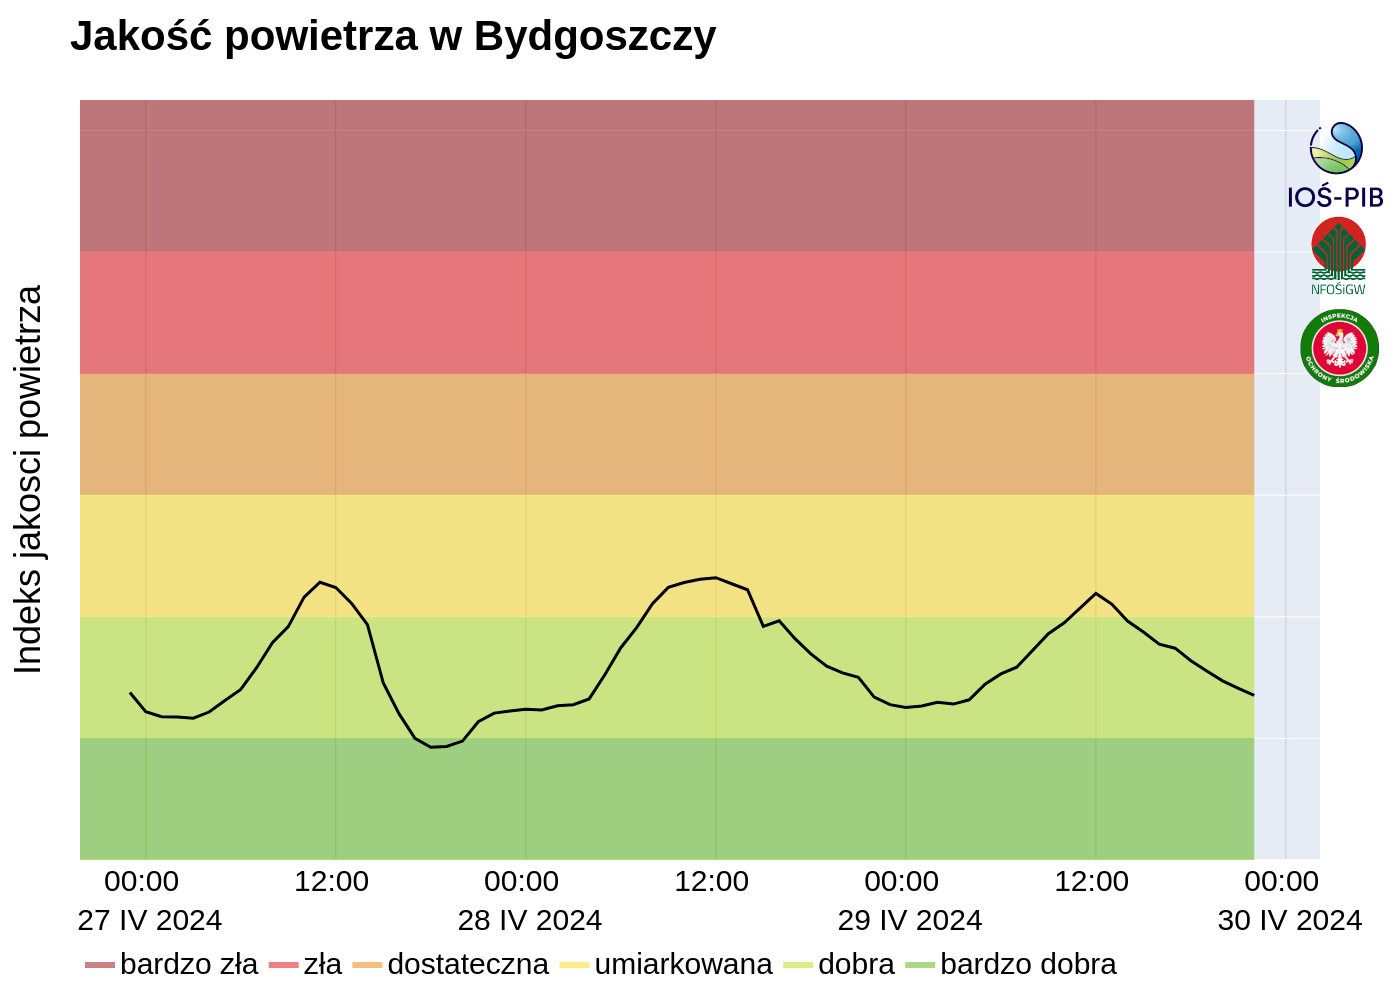
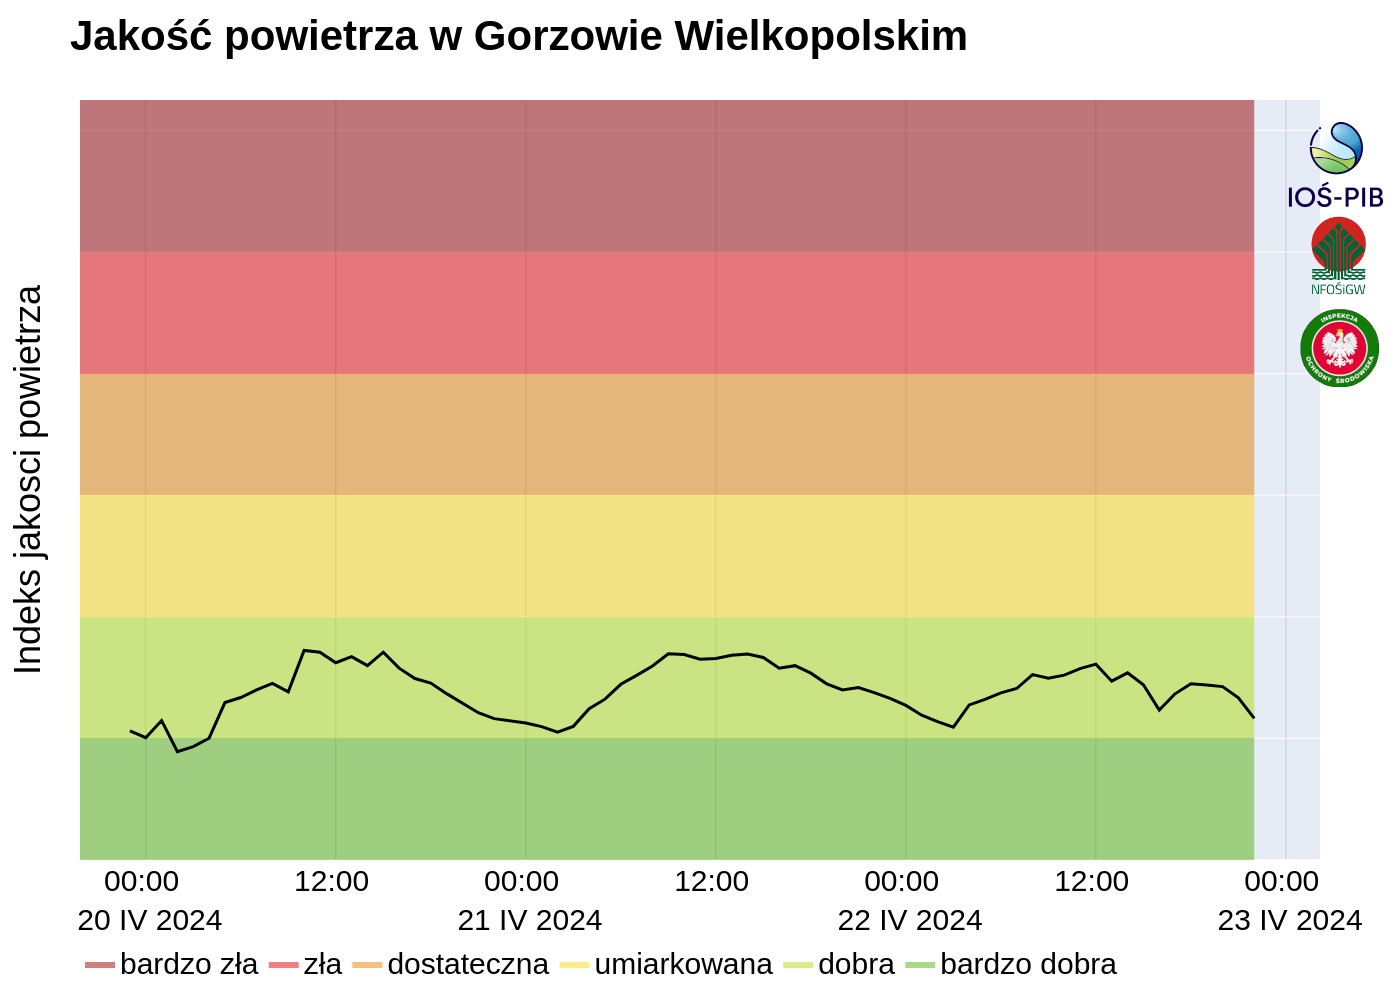
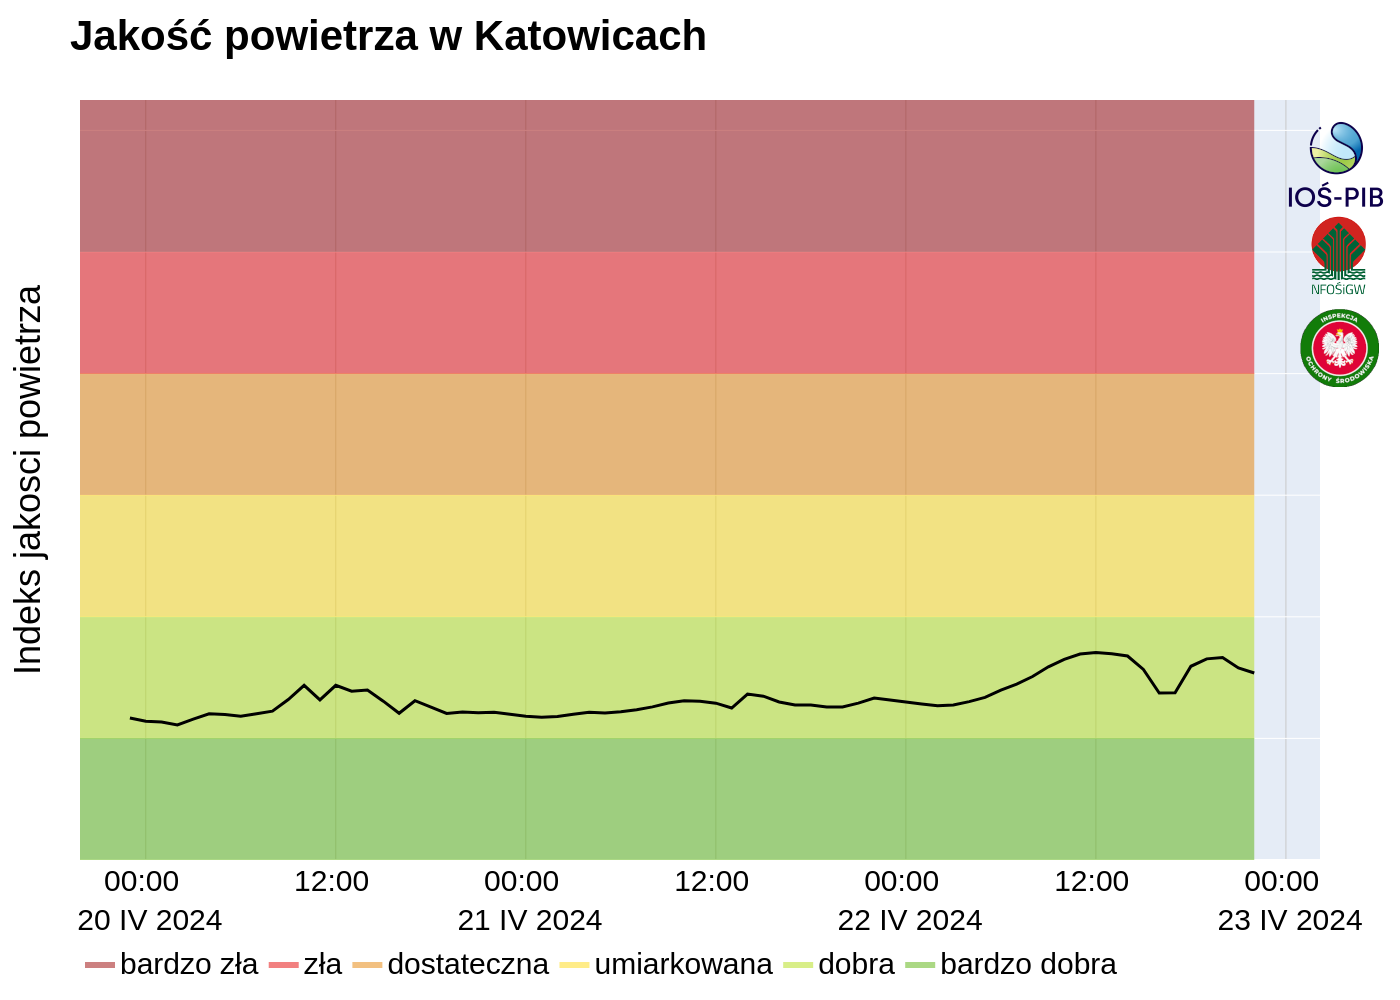
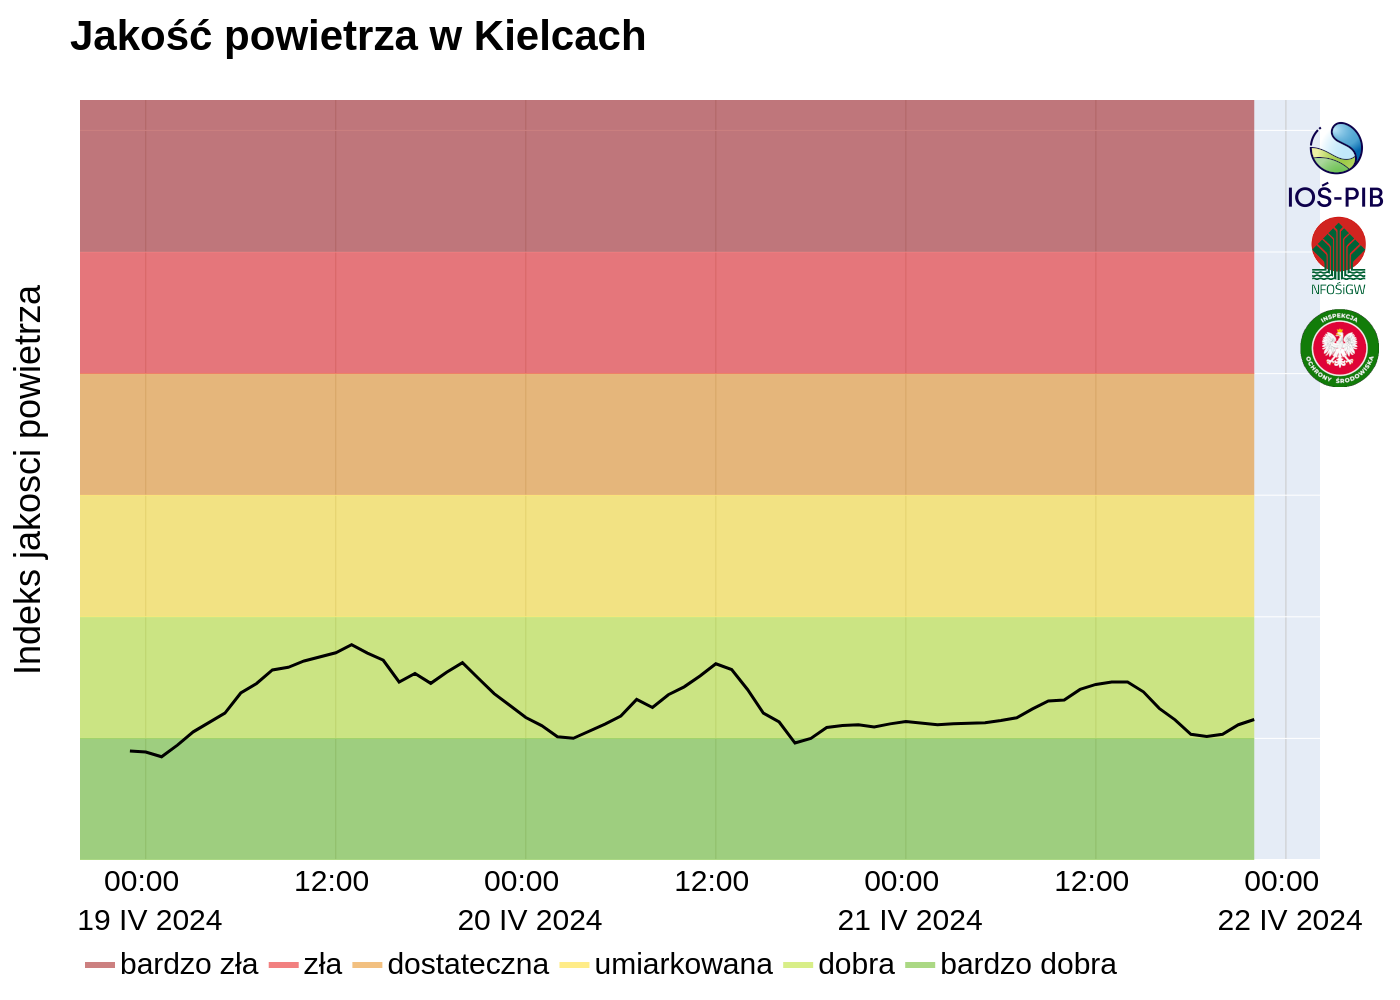
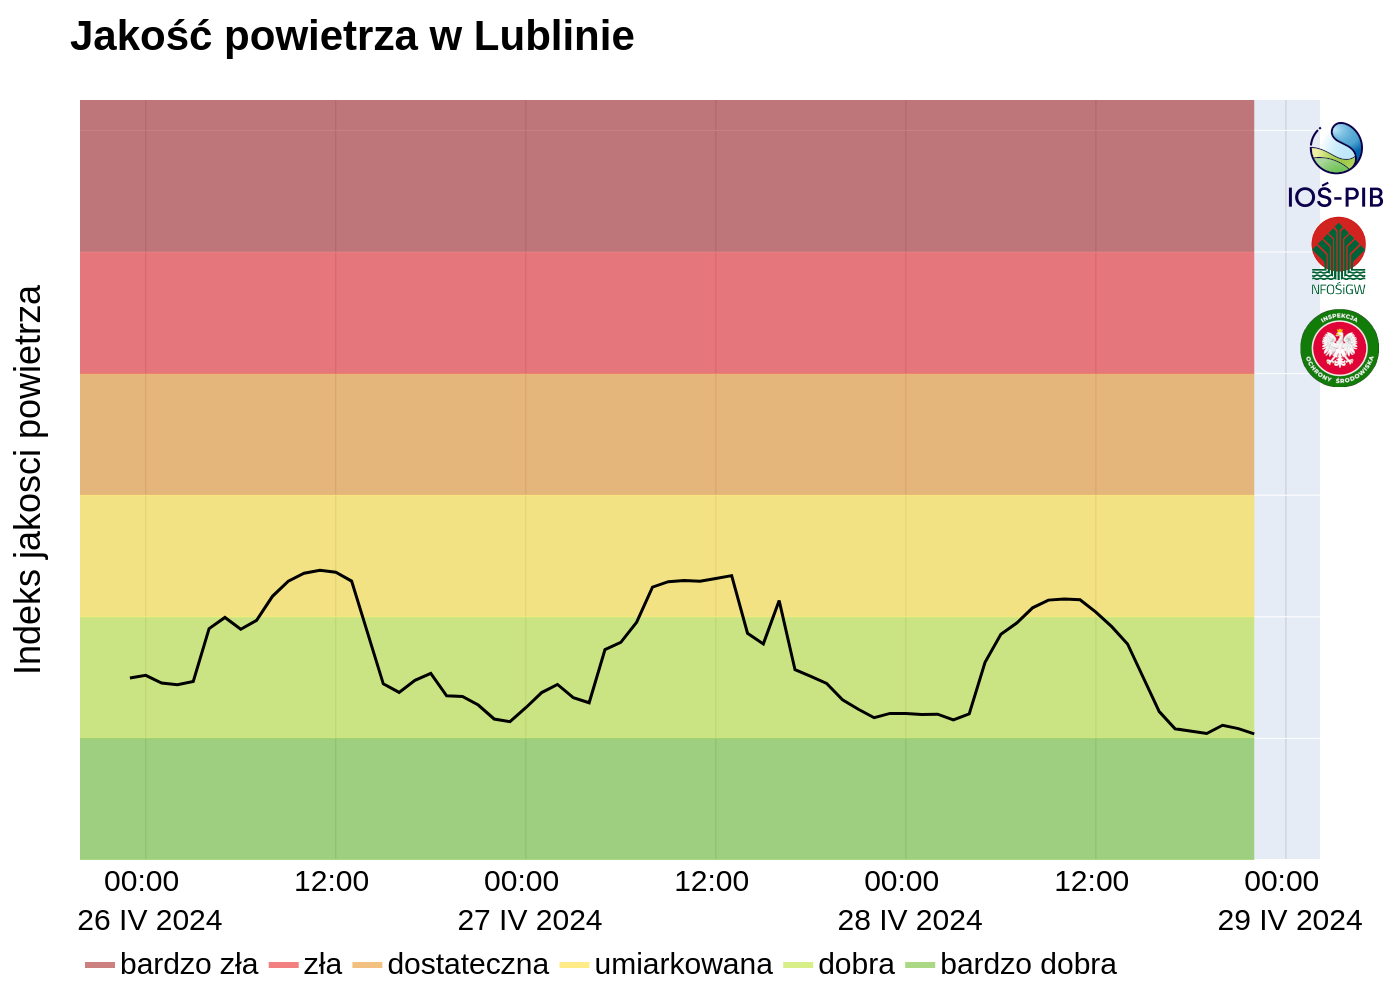
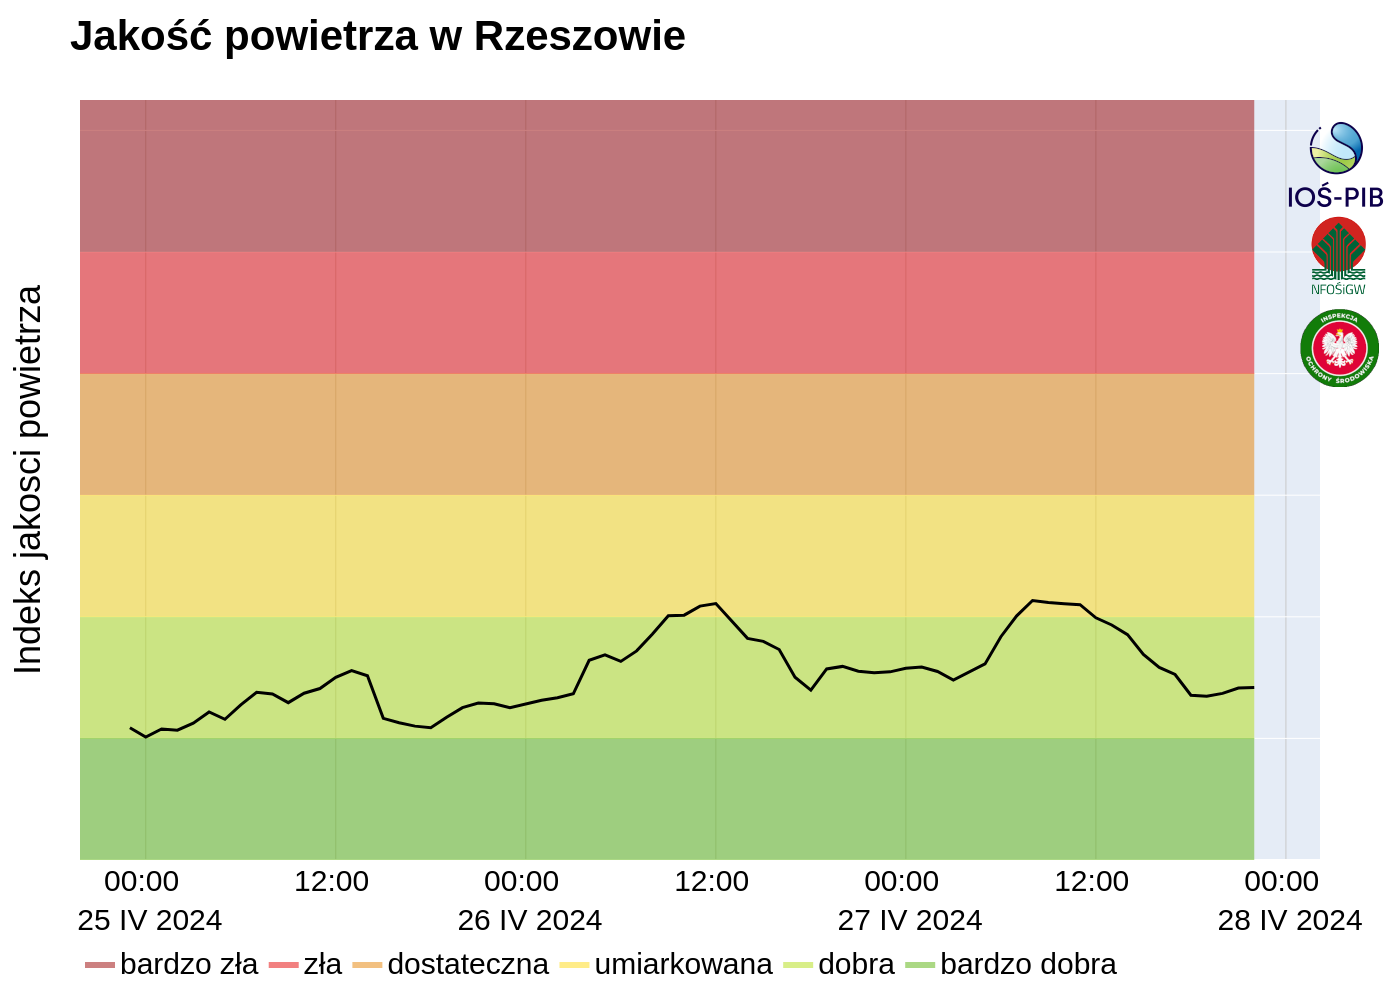
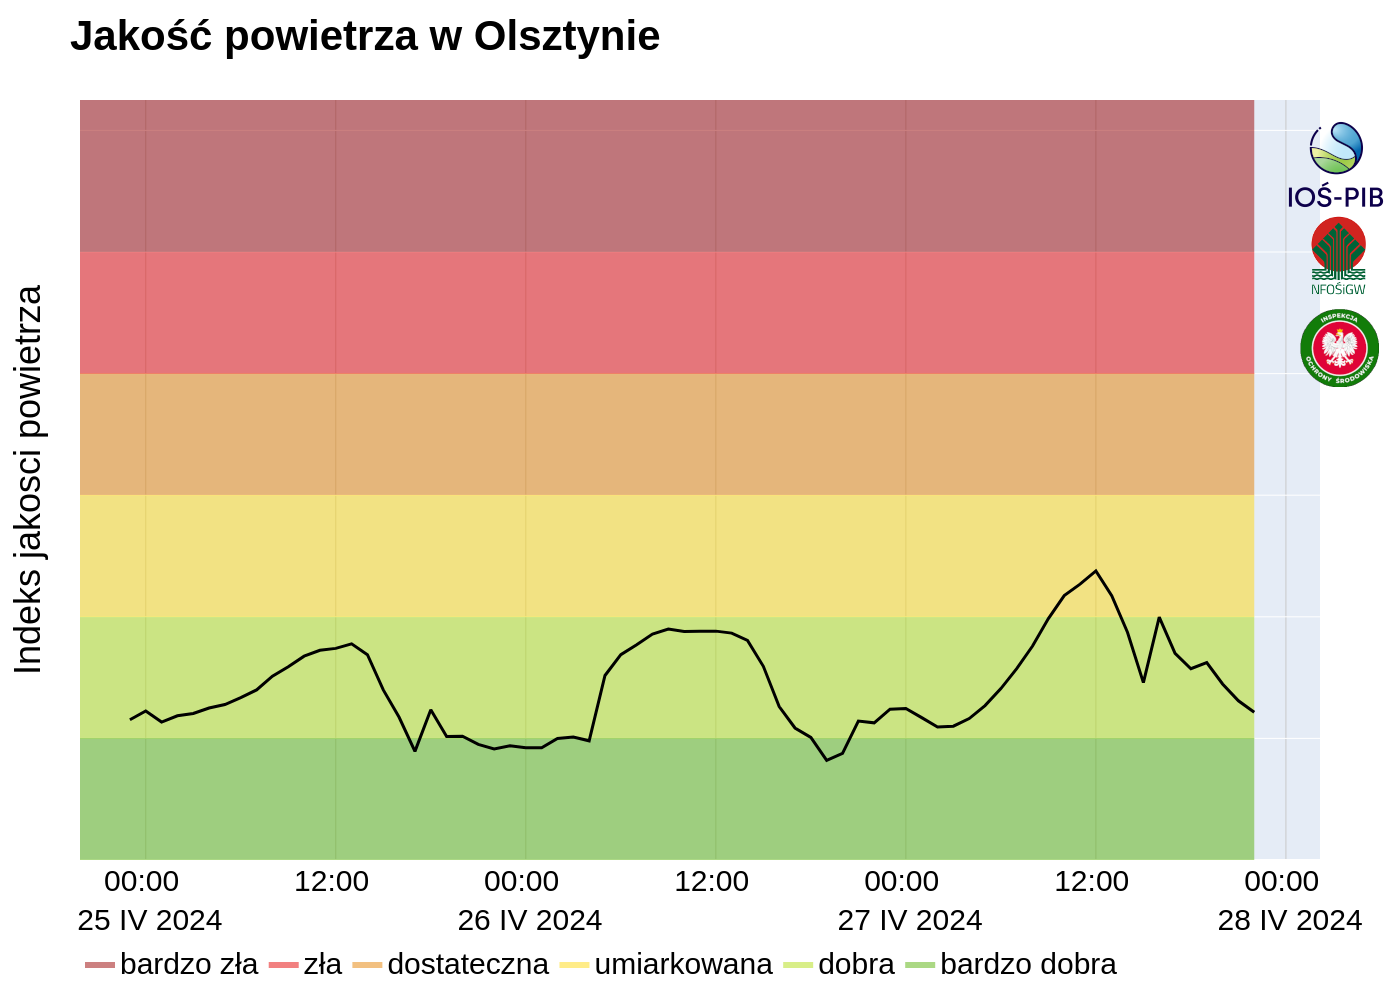
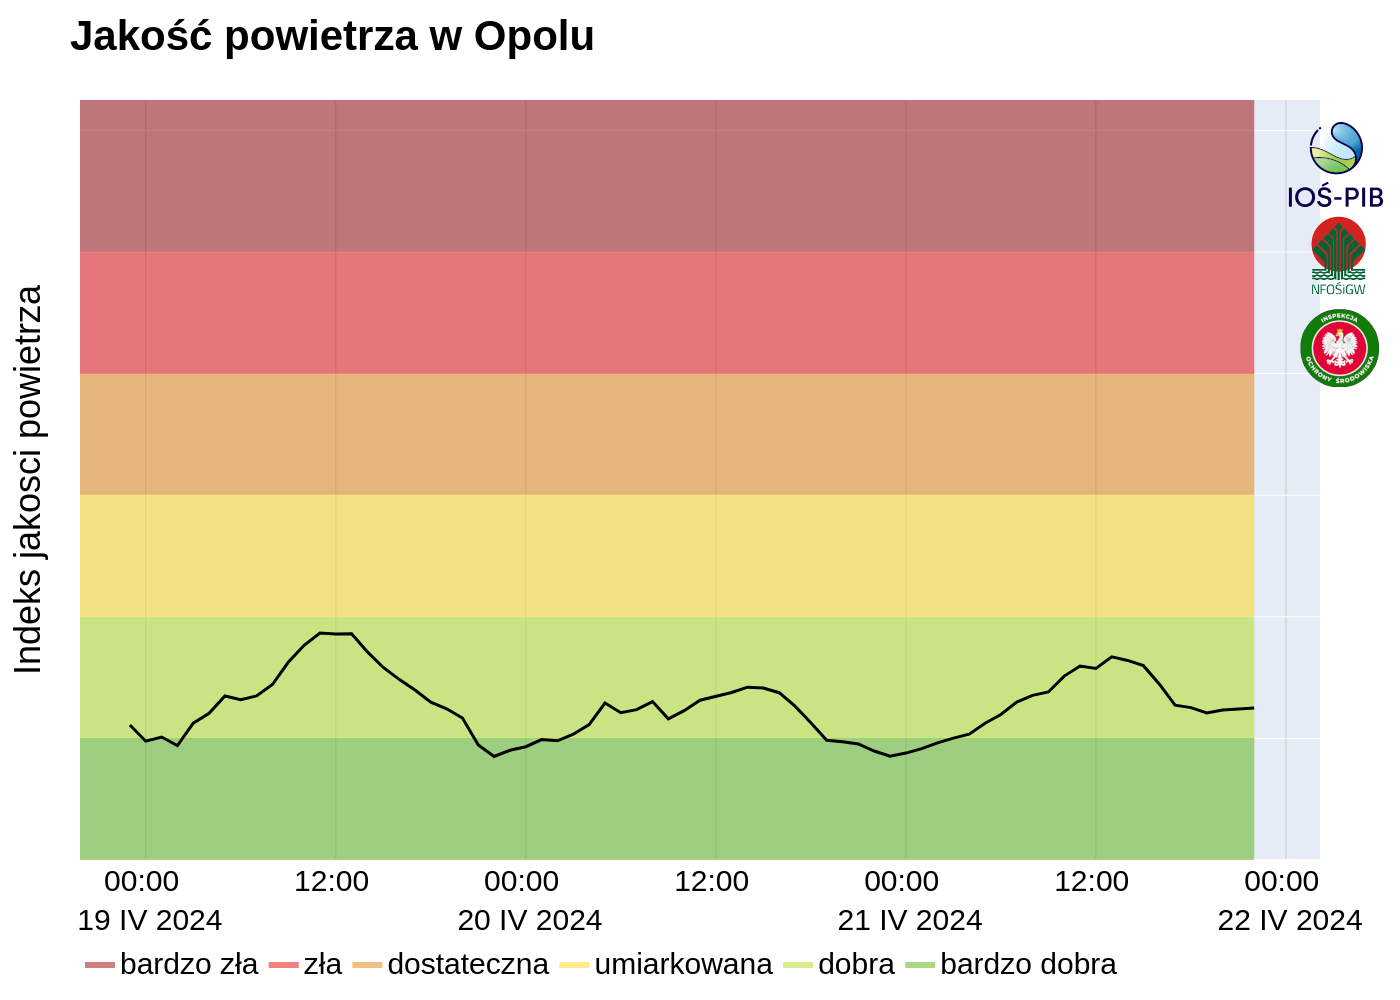
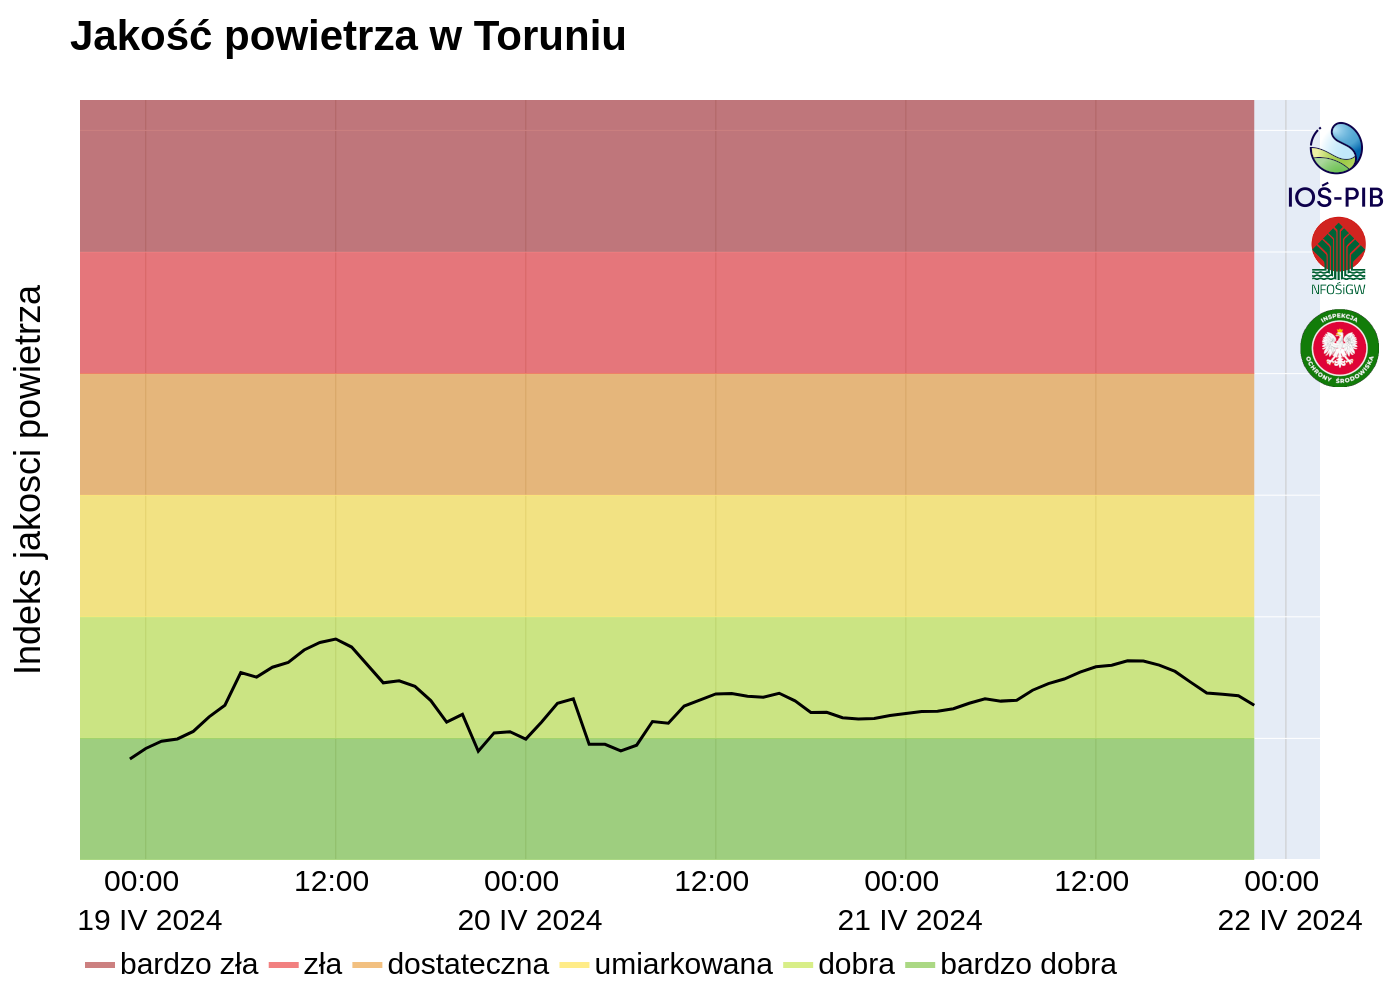
- trend of index changes in voivodeship (regional) cities
- animation of the index distribution over the area of Poland
| Air Quality Index | PM10 [µg/m3] |
PM2,5 [µg/m3] |
O3 [µg/m3] |
NO2 [µg/m3] |
SO2 [µg/m3] |
|---|---|---|---|---|---|
| Very good | 0 – 20 | 0 – 13 | 0 – 70 | 0 – 40 | 0 – 50 |
| Good | 20,1 – 50 | 13,1 – 35 | 70,1 – 120 | 40,1 – 100 | 50,1 – 100 |
| Moderate | 50,1 – 80 | 35,1 – 55 | 120,1 – 150 | 100,1 – 150 | 100,1 – 200 |
| Sufficient | 80,1 – 110 | 55,1 – 75 | 150,1 – 180 | 150,1 – 230 | 200,1 – 350 |
| Bad | 110,1 – 150 | 75,1 – 110 | 180,1 – 240 | 230,1- 400 | 350,1 – 500 |
| Very bad | > 150 | > 110 | > 240 | > 400 | > 500 |
The ranges of the individual thresholds are characterized by left-open and right-closed intervals, meaning, for example, that a PM10 value of 49.9 µg/m³ and 50.0 µg/m³ both correspond to the “Good” index, whereas a PM10 value of 51.1 µg/m³ is classified as the “Moderate” index.
When assigning thresholds, the same principles are applied as when comparing with limit values. For example, if the standard is 50 µg/m³, a concentration of 50 µg/m³ is not yet considered an exceedance. No rounding is applied when classifying values into index classes.
The Polish air quality index is calculated based on 1-hour results from modeling concentrations in the air of sulfur dioxide (SO2), nitrogen dioxide (NO2), PM10 particulate matter, PM2.5 particulate matter, and ozone (O3).
Then, the overall index takes the value of the worst individual index among the pollutants measured at that station or takes the value of the dominant pollutant (particulate matter or ozone).
source: powietrze.gios.gov.pl
AIR QUALITY INDEX FOR POLAND

Providing information in the form of forecasts for cities is especially important for people engaging in any form of outdoor activity, particularly sports and recreation. This knowledge is also very important for the elderly, the sick, pregnant women, and parents with young children-social groups that are particularly vulnerable to the adverse effects of air pollutions.
The information will be expanded for non-urban areas.
AIR QUALITY INDEX FOR VOIVODESHIP CITIES


 The statutory task financed from the funds of the National Fund for Environmental Protection and Water Management.